
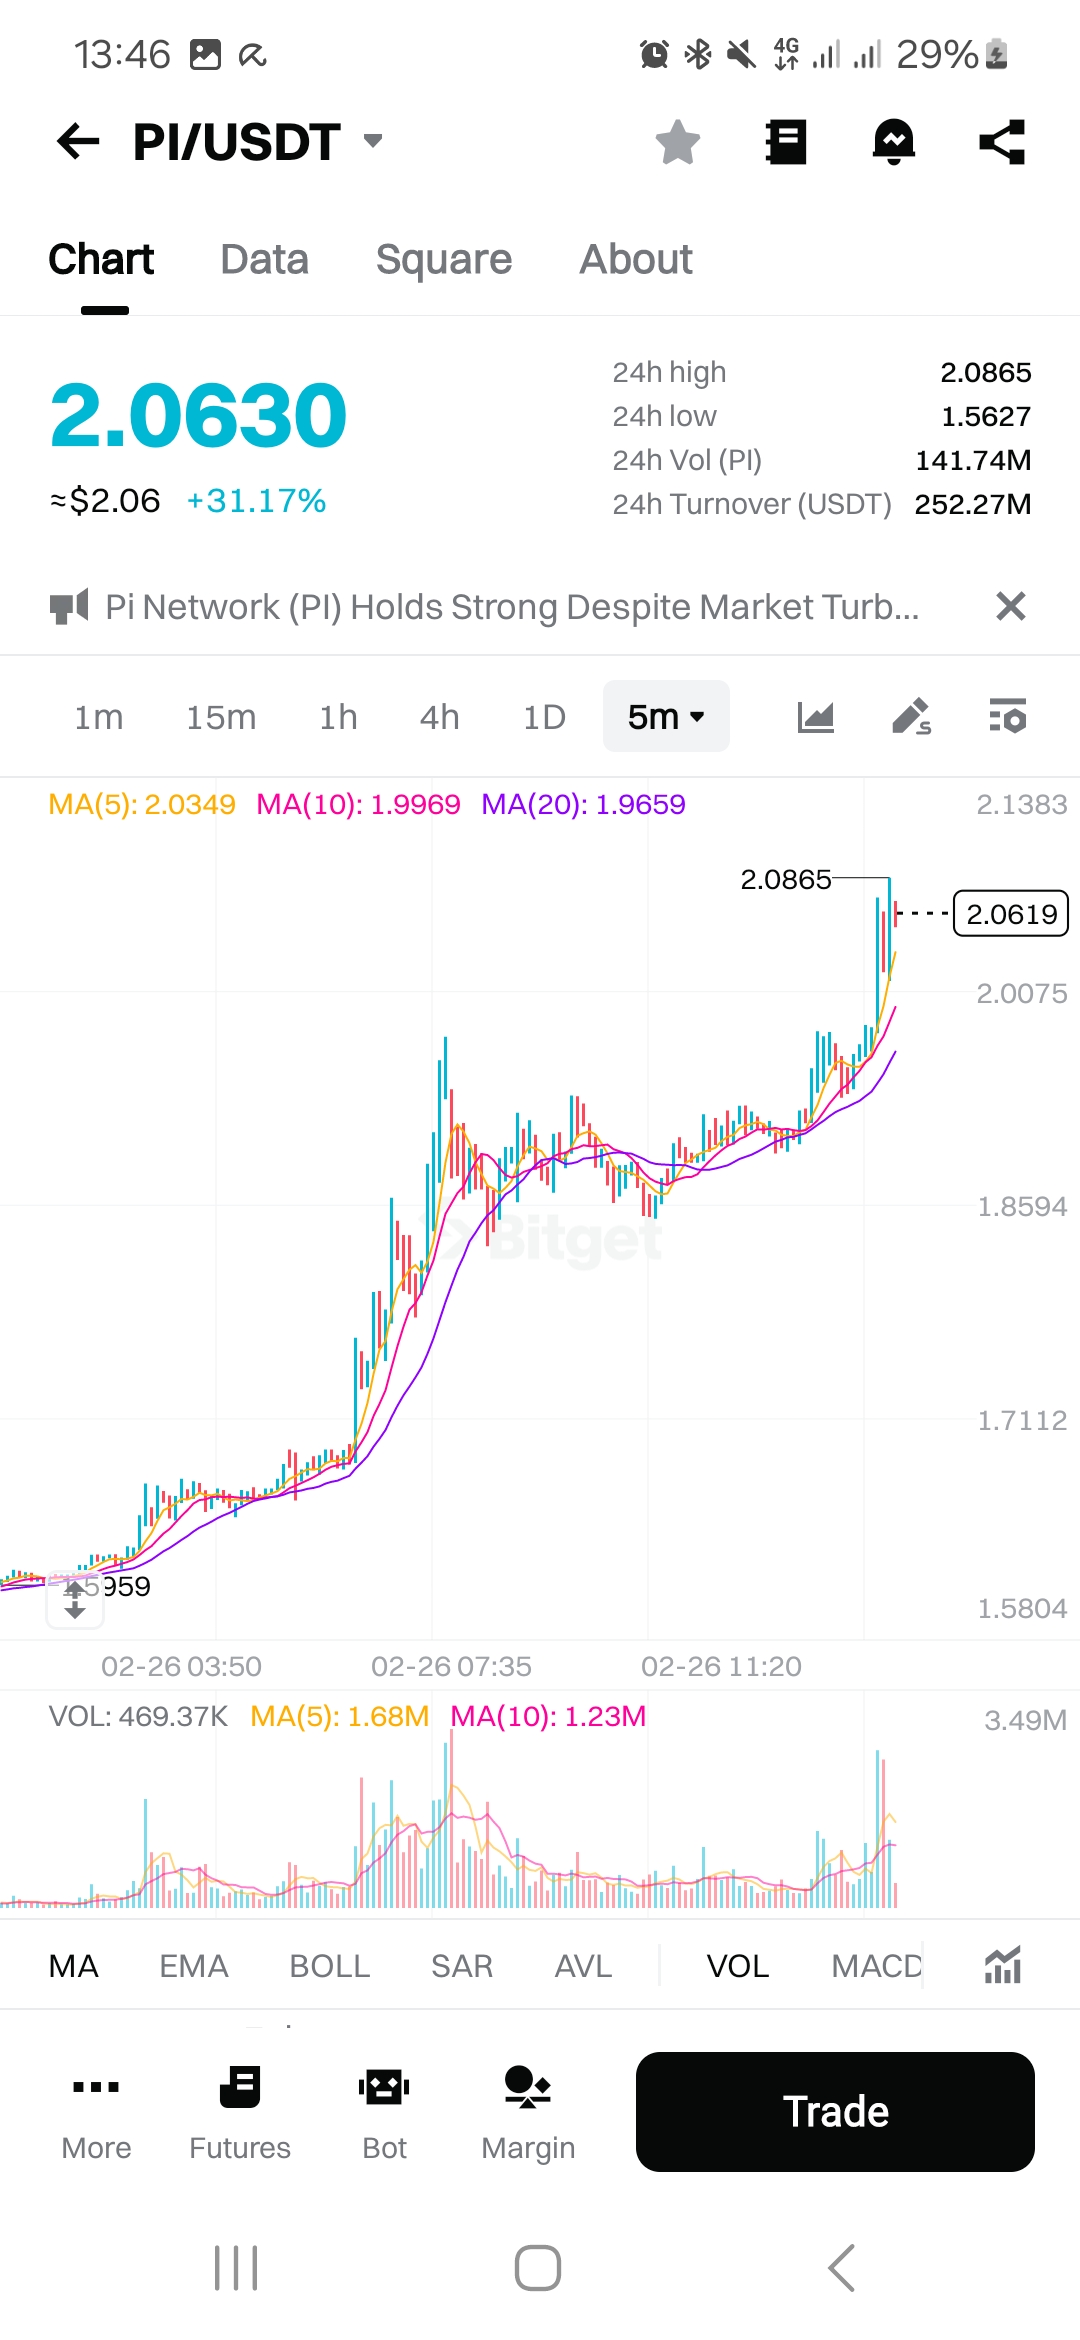
According to the bitget platform on 26/02/25, 14:00 PI/USDT, focusing on a 5-minute interval, the price of PI is 2.0630 USDT, marking a significant 31.17% increase. Let’s delve into the various elements of the chart to better understand the market dynamics and potential implications.

Price Movement:
The chart depicts the price fluctuations of PI over a short time frame, highlighting a notable peak at 2.0865 USDT. The price is currently just slightly below this peak at 2.0630 USDT. This close proximity to the peak suggests that the market might be facing resistance at this level. The current bullish momentum, however, indicates that investors are optimistic about PI’s potential to break through this resistance and continue its upward trajectory.
Moving Averages (MA):
Three moving averages are plotted on the chart:
- MA(5): 2.0349
- MA(10): 1.9969
- MA(20): 1.9659
Moving averages are crucial indicators used to smooth out price action and identify trends over specified periods. The order of the MAs (with the shortest, MA(5), at the highest value, and the longest, MA(20), at the lowest) confirms the ongoing uptrend. It implies that recent price action has been bullish, and shorter-term averages are responding more quickly to this upward momentum.
Volume Analysis:
The volume chart beneath the price chart provides insight into trading activity. The significant trading volume is evident, with a 24-hour volume of 141.74 million PI and a turnover of 252.27 million USDT. The moving averages of the volume are as follows:
- MA(5): 1.68 million
- MA(10): 1.23 million
High trading volumes typically accompany strong price movements and indicate that a substantial number of investors are actively trading the asset. The increase in volume further solidifies the strength of the current bullish trend, as more participants enter the market.
24-Hour Range:
The 24-hour high is recorded at 2.0865 USDT, while the low is at 1.5627 USDT. This wide range reflects substantial volatility in the market, which can be both a risk and an opportunity for traders. The fact that the price is nearing its 24-hour high suggests that the bullish trend might still have some room to run before it encounters significant resistance.
Conclusion:
The PI/USDT trading chart on the Bitget platform reflects a bullish trend, supported by strong volume and positive price momentum. While the proximity to the 24-hour high may indicate potential resistance, the overall technical indicators, such as moving averages, suggest continued optimism among traders. For more information about PI, visit our website.

